This tutorial has 3 major sections
Running the processing code : 0_main
loading packages/functions
We utilize the pacman library to load all the required packages. The helper function loadFunctions() can be called to load the 40 plus functions associated with the codebase.
Project file folder structure.
R : The folder for all functions connected to the data processing code base. All functions at this level are associated with the production of a score value.
R/Utilities: These helper functions are generally called from other functions and are unlikely to require any adjustment of input parameters. These functions also do not produce any indicator score values.
Create file folder structure
As the codebase is writing out numerous intermediate files, we’ve opted to generate a standardized file folder structure that accounts for inputs, outputs, and shiny specific features. This folder structure also enables the development of version specific outputs.
Run the createFolderStructure() function. This will create a data folder in your R project directory. Within the data folder are subfolders for input, output, and shinyContent.
Populate the input folder
Copy the extracted data from the COEnviroScreen_dataInputs repository into the data/input folder. There can not be any intermediate folders between the input folder and the specific indicator folders. For example you relative path the the asthma dataset should look like:
"~data/input/asthma/Asthma_Hospitalization_Rate_(Census_Tracts).csv"
Gather Geometry Layers
The geometry features for Colorado Counties, Census Tracts, and Census Block Groups are used in the EnviroScreen data calculation. To ensure the consistency of these features the layers are pulled directly from the tigris R library and stored as geojsons within the output/spatialLayers folder.
Run the getGeometryLayers() function to gather these layers.
Census API key
Data pertaining to multiple indicators is gather directly from the 2019 American Community Survey. This content is accessed via the tidycensus library which requires a unique census API key. The census API key can be obtained here. There is currently no costs associated with utilizing the Census API key.
Run the tidycensus::census_api_key(key = "your key") function to ensure you are able to pull dataset using the tidycensus package later in the data processing.
Generate the score values
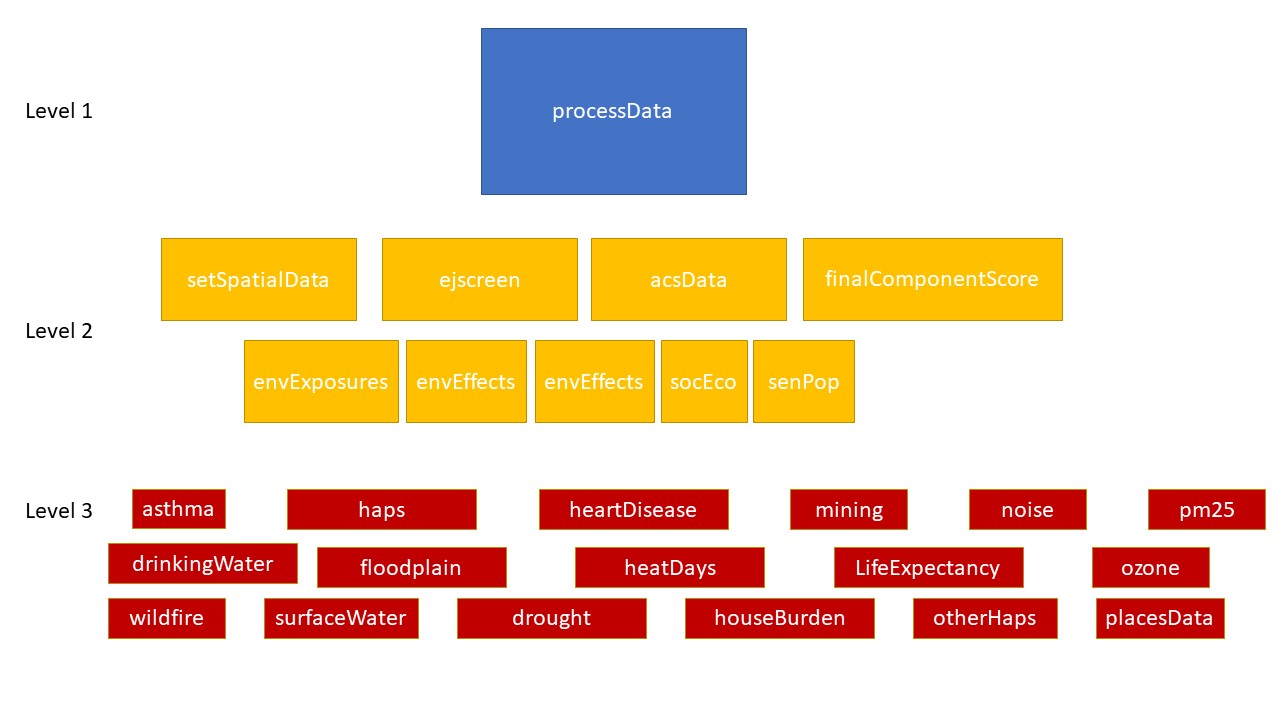
The processData function is used to generate all score values connected with the calculation of the EnviroScreen score. The function itself is the start of the hierarchical score calcualtions. This is important because the input parameters used for this function (processingLevel, version, overwrite) are passed to all other processing functions, unless specific altered within a separate function call.
Diagram for the three level of functions within the processData function.

As the bulk of the data processing is performed as part of this processData function this process can take a while to run. We recommend running the process with the “county” processingLevel first.
This can be done with the following code
 processData(processingLevel="county",
             version = version,
             overwrite = FALSE)
You can run all geographies utilizing a for loop
geoms <- c("county","censusTract","censusBlockGroup")

for(i in geoms){
  print(i)
  processData(processingLevel=i,
              version = version,
              overwrite = FALSE)
}
Compiling the data for shiny
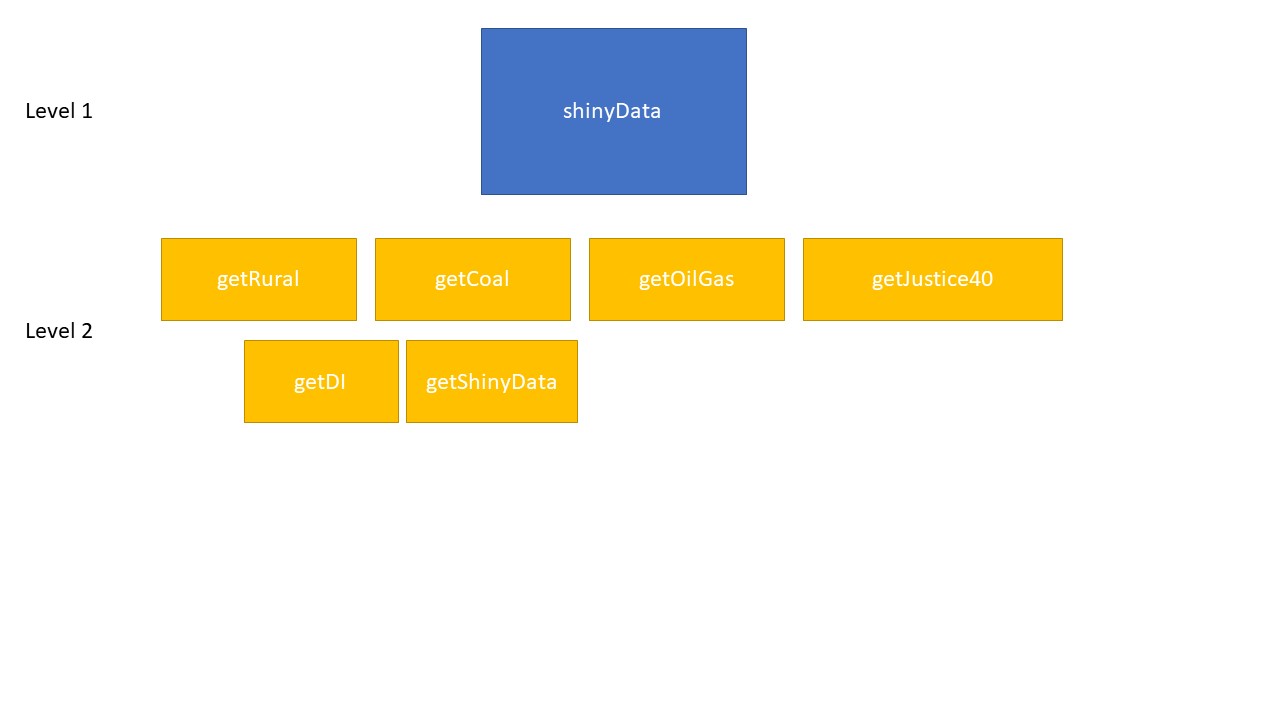
The shiny applications require six rds files to run. This includes 5 map elements and a spatial object that combines all the calculated values from each of the three geographies. Note this function will not run unless scores have been created for all three geographies at the current version.
Diagram below shows the two levels of functions within the shinyData function.

All outputs from this process will saved to the shinyContent folder